ISO9001 Certified Professional Manufacturer & Supplier of Optics
+86-0431-87911611 admin@ytoptics.com
Contact us
-
 Email: admin@ytoptics.com
-
 English Inquiry Support:
-
 Add: 2# Automotive InnovationPark,
City,Jilin Province, China
Comparison of RMSi and RMSa
I. Core Summary:
RMSi: Describes the irregularity of microscopic surface undulations, primarily referring to “roughness.”
RMSa: Describes the deviation of a surface's macroscopic shape from an ideal shape, primarily referring to “surface profile error.”
Although both are “root mean square” values used to quantify surface “imperfections,” they focus on entirely different spatial frequency (wavelength) ranges.
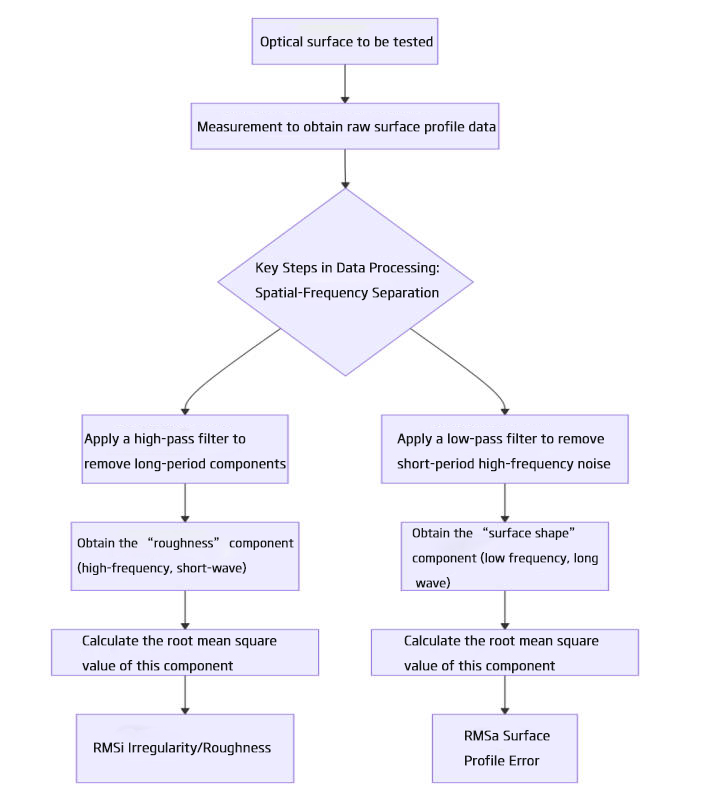
The diagram below clearly illustrates their differences and measurement methods:
II. Detailed Explanation:
RMSi (Root Mean Square irregularity) - Irregularity/Roughness
1. Definition: The root mean square value of the remaining high-frequency, small-scale random undulations after removing the surface's macroscopic shape (spherical, aspherical, planar, etc.) and medium-spatial errors.
2. Focus Range: High spatial frequency components. Typically corresponds to tool marks left during machining, pitting caused by polishing particles, and microscopic material inhomogeneities. Its characteristic size (wavelength) is usually much smaller than the aperture of the optical element.
3. Measurement and Calculation:
Requires measurement within a small area using a high-resolution profilometer (e.g., white light interferometer, atomic force microscope).
Measurement data undergoes “skew removal” and “optimal fit spherical/planar removal,” followed by high-pass filtering to eliminate mid-to-low frequency components. The remaining high-frequency profile data is then used to calculate the root mean square value.
4. Primary Effects:
Scattering Loss: Causes light energy to scatter away from the principal ray direction, reducing system contrast and signal-to-noise ratio, with small-angle scattering.
Significantly impacts the MTF (Modulation Transfer Function) of imaging systems in the mid-to-high frequency range.
5. Typical Applications:
Laser systems, high-resolution imaging systems, X-ray optical components, and any application requiring extremely low scattering.
Typical Values:
Varies from standard polishing (~10 nm RMSi) to ultra-smooth polishing (< 0.5 nm RMSi).
RMSa (Root Mean Square accuracy) - Surface Profile Accuracy
1. Definition: The root mean square value of deviations between the actual optical surface and the designed ideal surface (e.g., ideal sphere, ideal parabola). This deviation is holistic and systematic.
2. Scope of Focus: Low spatial frequency components. Describes whether the overall shape of the surface is “correct,” such as a sphere with incorrect curvature, or errors exhibiting aberration forms like astigmatism or coma.
3. Measurement and Calculation:
Typically measured across the entire optical aperture using interferometers (e.g., Fizeau interferometers, phase-shift interferometers).
The measured wavefront map (or surface profile) is subtracted from an ideal reference wavefront (or surface profile) to generate a surface error map. The root mean square value is then directly calculated for all data points across the entire region.
4. Primary Effects:
Wavefront errors: Directly degrade imaging quality by introducing aberrations (defocus, astigmatism, spherical aberration, etc.).
Impact system parameters including Strehl ratio, PSF (point spread function), and focal spot energy concentration.
5. Typical Applications:
All imaging optical systems, telescopes, lithography lenses, laser resonator mirrors.
Typical Values:
Ranges from general optics (RMSa of λ/10, approx. 63 nm @ 632.8 nm) to ultra-precision optics (RMSa of λ/1000, approx. 0.6 nm @ 632.8 nm).
Key Comparison Table
|
Characteristic |
RMSi (Irregularity/Roughness) |
RMSa (Surface Profile Accuracy) |
|
Nature |
Micro-scale random undulations, roughness |
Macro-scale systematic deviations, shape errors |
|
Spatial Frequency |
High (short wavelengths) |
Low (long wavelengths) |
|
Scale |
Far smaller than component aperture (micrometer-scale features) |
Equivalent to or larger than component aperture |
|
Measurement Tools |
Profile gauges, white light interferometers, AFM |
Phase-shift interferometers |
|
Data Processing |
Requires removal of macroscopic shape and high-pass filtering |
Direct comparison with ideal surface profile |
|
Primary Effects |
Scattering, reduced signal-to-noise ratio and contrast |
Wavefront error/aberration, reduced imaging resolution and Strehl ratio |
|
Analogy |
Surface fiber roughness on a sheet of paper |
Overall wrinkling on a sheet of paper after crumpling |
III. Key Relationships and Summary
1. Separate Yet Coexisting: The total error of an actual optical surface comprises multiple frequency components, including RMSa (low-frequency), mid-frequency errors, and RMSi (high-frequency). Comprehensive characterization requires analyzing its power spectral density.
2. Distinct Process Controls:
RMSa is primarily determined by forming, grinding, and rough polishing processes, reflecting the manufacturer's ability to control overall shape.
RMSi is mainly influenced by final fine polishing, finishing processes, and the material itself, indicating the capability to achieve ultra-smooth surfaces.
3. Application-Oriented Considerations:
For imaging systems (e.g., cameras, telescopes), RMSa is typically more critical as it directly impacts image clarity.
For high-power laser systems or low-scatter applications (e.g., gravitational wave detection), RMSi is paramount because micro-roughness absorbs or scatters laser light, causing thermal distortion or even component damage.
4. Units: Both are typically expressed in length units (e.g., nanometers, nm). However, RMSa is also commonly represented as a fraction of wavelength (e.g., λ/20), where λ usually refers to 632.8 nm (He-Ne laser).
In short: RMSa indicates whether a mirror's “shape” is correct, while RMSi indicates how smooth the mirror's “surface” is. Together, they determine the ultimate performance of an optical element.
Share this:
PREV : Comparison of Fused Silica Materials NEXT : Guide to Polarized Light Principles: Definitions, Applications, and Why Distinguishing P-Polarized a
TALK TO US 86-15584132290
Call us now!
86-15584132290Call us now!

ONLINE CHAT
 2433808388